|
R&D Systems
recombinant galectin 9 Recombinant Galectin 9, supplied by R&D Systems, used in various techniques. Bioz Stars score: 93/100, based on 1 PubMed citations. ZERO BIAS - scores, article reviews, protocol conditions and more https://www.bioz.com/result/recombinant galectin 9/product/R&D Systems Average 93 stars, based on 1 article reviews
recombinant galectin 9 - by Bioz Stars,
2026-04
93/100 stars
|
Buy from Supplier |
|
R&D Systems
human galectin 7 proteins levels Human Galectin 7 Proteins Levels, supplied by R&D Systems, used in various techniques. Bioz Stars score: 94/100, based on 1 PubMed citations. ZERO BIAS - scores, article reviews, protocol conditions and more https://www.bioz.com/result/human galectin 7 proteins levels/product/R&D Systems Average 94 stars, based on 1 article reviews
human galectin 7 proteins levels - by Bioz Stars,
2026-04
94/100 stars
|
Buy from Supplier |
|
R&D Systems
recombinant human galectin 3 protein  Recombinant Human Galectin 3 Protein, supplied by R&D Systems, used in various techniques. Bioz Stars score: 94/100, based on 1 PubMed citations. ZERO BIAS - scores, article reviews, protocol conditions and more https://www.bioz.com/result/recombinant human galectin 3 protein/product/R&D Systems Average 94 stars, based on 1 article reviews
recombinant human galectin 3 protein - by Bioz Stars,
2026-04
94/100 stars
|
Buy from Supplier |
|
R&D Systems
recombinant galectin Recombinant Galectin, supplied by R&D Systems, used in various techniques. Bioz Stars score: 93/100, based on 1 PubMed citations. ZERO BIAS - scores, article reviews, protocol conditions and more https://www.bioz.com/result/recombinant galectin/product/R&D Systems Average 93 stars, based on 1 article reviews
recombinant galectin - by Bioz Stars,
2026-04
93/100 stars
|
Buy from Supplier |
|
R&D Systems
recombinant human gal 9 protein Recombinant Human Gal 9 Protein, supplied by R&D Systems, used in various techniques. Bioz Stars score: 94/100, based on 1 PubMed citations. ZERO BIAS - scores, article reviews, protocol conditions and more https://www.bioz.com/result/recombinant human gal 9 protein/product/R&D Systems Average 94 stars, based on 1 article reviews
recombinant human gal 9 protein - by Bioz Stars,
2026-04
94/100 stars
|
Buy from Supplier |
|
R&D Systems
recombinant galectin binding Recombinant Galectin Binding, supplied by R&D Systems, used in various techniques. Bioz Stars score: 94/100, based on 1 PubMed citations. ZERO BIAS - scores, article reviews, protocol conditions and more https://www.bioz.com/result/recombinant galectin binding/product/R&D Systems Average 94 stars, based on 1 article reviews
recombinant galectin binding - by Bioz Stars,
2026-04
94/100 stars
|
Buy from Supplier |
|
R&D Systems
recombinant protein  Recombinant Protein, supplied by R&D Systems, used in various techniques. Bioz Stars score: 93/100, based on 1 PubMed citations. ZERO BIAS - scores, article reviews, protocol conditions and more https://www.bioz.com/result/recombinant protein/product/R&D Systems Average 93 stars, based on 1 article reviews
recombinant protein - by Bioz Stars,
2026-04
93/100 stars
|
Buy from Supplier |
|
R&D Systems
cf 9064 ga 050 r d systems Cf 9064 Ga 050 R D Systems, supplied by R&D Systems, used in various techniques. Bioz Stars score: 92/100, based on 1 PubMed citations. ZERO BIAS - scores, article reviews, protocol conditions and more https://www.bioz.com/result/cf 9064 ga 050 r d systems/product/R&D Systems Average 92 stars, based on 1 article reviews
cf 9064 ga 050 r d systems - by Bioz Stars,
2026-04
92/100 stars
|
Buy from Supplier |
|
R&D Systems
recombinant mouse gal 1 Recombinant Mouse Gal 1, supplied by R&D Systems, used in various techniques. Bioz Stars score: 92/100, based on 1 PubMed citations. ZERO BIAS - scores, article reviews, protocol conditions and more https://www.bioz.com/result/recombinant mouse gal 1/product/R&D Systems Average 92 stars, based on 1 article reviews
recombinant mouse gal 1 - by Bioz Stars,
2026-04
92/100 stars
|
Buy from Supplier |
|
R&D Systems
recombinant galectin 1  Recombinant Galectin 1, supplied by R&D Systems, used in various techniques. Bioz Stars score: 93/100, based on 1 PubMed citations. ZERO BIAS - scores, article reviews, protocol conditions and more https://www.bioz.com/result/recombinant galectin 1/product/R&D Systems Average 93 stars, based on 1 article reviews
recombinant galectin 1 - by Bioz Stars,
2026-04
93/100 stars
|
Buy from Supplier |
|
R&D Systems
rmgal 9 Rmgal 9, supplied by R&D Systems, used in various techniques. Bioz Stars score: 94/100, based on 1 PubMed citations. ZERO BIAS - scores, article reviews, protocol conditions and more https://www.bioz.com/result/rmgal 9/product/R&D Systems Average 94 stars, based on 1 article reviews
rmgal 9 - by Bioz Stars,
2026-04
94/100 stars
|
Buy from Supplier |
Image Search Results
Journal: bioRxiv
Article Title: Defining the mechanism of galectin-3-mediated TGF-β1 activation and its role in lung fibrosis
doi: 10.1101/2023.10.11.561855
Figure Lengend Snippet: Representative western blot of pSmad2 levels in (A) non-IPF HLFs (N=3) and (B) iHBECs (N=2) pre-treated with S0 μM SB-431S42 (ALKS inhibitor) or 1 μM GB0139 (galectin-3 inhibitor) for 20 minutes prior to 2-hour treatment with 10 μg/mL galectin-3 or 2 ng/mL TGF-β1. Western blot bands were quantified using densitometry analysis and presented as a ratio of pSmad2/tSmad2.
Article Snippet: After serum starvation, cells were stimulated with either 10 μg/mL
Techniques: Western Blot

Journal: bioRxiv
Article Title: Defining the mechanism of galectin-3-mediated TGF-β1 activation and its role in lung fibrosis
doi: 10.1101/2023.10.11.561855
Figure Lengend Snippet: Representative western blots of pSmad2 levels in non-IPF HLFs pre-treated with (A) NOTT199SS β1 inhibitor (0.1-100 nM) or (B-D) galectin-3 inhibitors GB0139, GB1107 and GB1211 (1 μM) or GB0149 (0.1-10 μM) for 20 minutes prior to stimulation with 2 ng/mL TGF-β1 (2-hour) or 50 μM LPA (4-hour). Cells pre-treated with S0 μM SB-431542 (ALK5 inhibitor) were included as a control demonstrating maximal inhibition of pSmad2 signaling. Western blot bands were quantified using densitometry analysis and presented as a ratio of pSmad2/tSmad2.
Article Snippet: After serum starvation, cells were stimulated with either 10 μg/mL
Techniques: Western Blot, Inhibition

Journal: bioRxiv
Article Title: Defining the mechanism of galectin-3-mediated TGF-β1 activation and its role in lung fibrosis
doi: 10.1101/2023.10.11.561855
Figure Lengend Snippet: Soluble galectin-3 (sequential injections, 19.5 - 5000 nM) binding to glycosylated or deglycosylated αv integrins: (A) αvβ1, (B) αvβS and (C) αvβ6 immobilised on the surface of a Series S sensor chip CM5 (approximately 1000 RU). (D) Soluble galectin-3 (sequential injections, 156.3-20000 nM) binding to glycosylated or deglycosylated TGFβRII immobilised to a Series S sensor chip CMS (approximately 400 RU). SPR signals were measured in RU and all sensorgrams baseline-corrected. Binding response values plotted in GraphPad Prism with connecting line/curve shown.
Article Snippet: After serum starvation, cells were stimulated with either 10 μg/mL
Techniques: Binding Assay
Journal: bioRxiv
Article Title: Defining the mechanism of galectin-3-mediated TGF-β1 activation and its role in lung fibrosis
doi: 10.1101/2023.10.11.561855
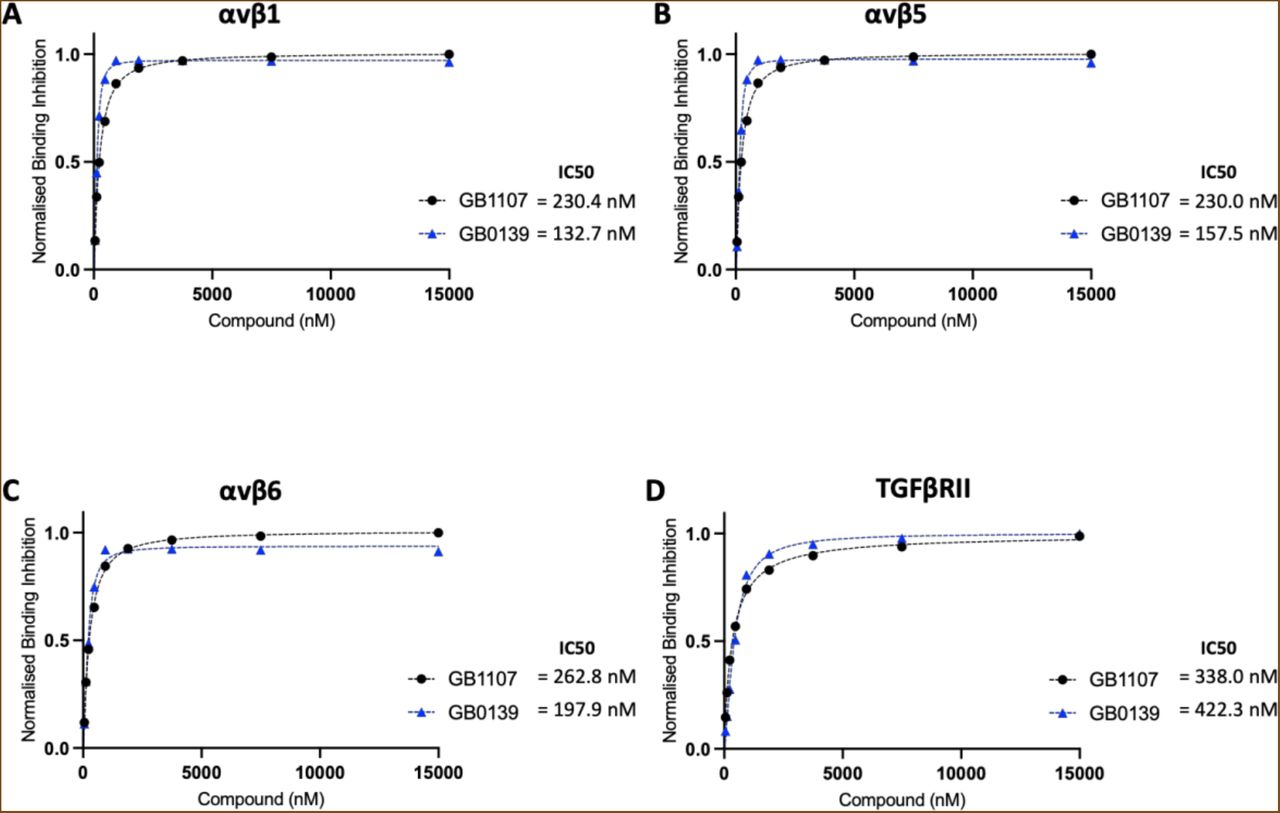
Figure Lengend Snippet: Solution competition binding assays performed with the galectin-3 inhibitor GB0139 (blue) or GB1107 (black) for αv integrins: (A) αvβ1, (B) αvβS and (C) αvβ6 or (D) TGFβRII in the presence of galectin-3 at 625 nM. Response values are normalised with respect to the highest binding response (DMSO control) and competitive inhibition graphs plotted in GraphPad Prism. IC50 values were calculated by non-linear regression analysis (binding saturation) - specific binding with hill slope.
Article Snippet: After serum starvation, cells were stimulated with either 10 μg/mL
Techniques: Binding Assay, Inhibition

Journal: bioRxiv
Article Title: Defining the mechanism of galectin-3-mediated TGF-β1 activation and its role in lung fibrosis
doi: 10.1101/2023.10.11.561855
Figure Lengend Snippet: Representative western blots showing co-immunoprecipitation of galectin-3 and the β1 integrin. Whole-cell protein lysates (6S0 μg/ IP reaction) from untreated non-IPF HLFs p6 (N=3) were immunoprecipitated with an anti-β1 integrin antibody (10 μg/ IP reaction) and immunoblotted for galectin-3 (upper panel) or immunoprecipitated with an anti-galectin-3 antibody (10 μg/ IP reaction) and immunoblotted for the β1 integrin (lower panel). Co-IP input, FT and wash steps loaded as controls. Proteins separated by reducing SDS-PAGE and target protein size estimated from the marker migration pattern.
Article Snippet: After serum starvation, cells were stimulated with either 10 μg/mL
Techniques: Western Blot, Immunoprecipitation, Co-Immunoprecipitation Assay, SDS Page, Marker, Migration

Journal: bioRxiv
Article Title: Defining the mechanism of galectin-3-mediated TGF-β1 activation and its role in lung fibrosis
doi: 10.1101/2023.10.11.561855
Figure Lengend Snippet: Representative confocal microscopy images (63x magnification) showing PLA of galectin-3 and the β1 integrin in (A) non-IPF HLFs p3-4 (N=3) or (B) IPF HLFs p3 (N=4) in the absence or presence of TGF-β1 stimulation (2 ng/mL TGF-β1 for 24 hours). Cells probed with a mouse anti-β1 integrin primary antibody (S μg/mL) and a rabbit anti-galectin-3 primary antibody (S μg/mL) followed by anti-rabbit PLUS and anti-mouse MINUS probes. Colocalization of galectin-3 and the β1 integrin 40 nm indicated by red fluorescence with DAPI counterstaining (blue).
Article Snippet: After serum starvation, cells were stimulated with either 10 μg/mL
Techniques: Confocal Microscopy, Fluorescence

Journal: bioRxiv
Article Title: Defining the mechanism of galectin-3-mediated TGF-β1 activation and its role in lung fibrosis
doi: 10.1101/2023.10.11.561855
Figure Lengend Snippet: (A) Downstream signaling of TGF-β1 following its integrin-mediated activation requires the integrin and TGF-β1 receptor to be in close proximity on the cell surface. (B) The galectin-3 carbohydrate binding domain binds to the glycosylation sites on αv integrins and the TGF-β1 receptor forming a galectin lattice at the cell surface which facilitates receptor clustering. This scaffold ensures that TGF-β1 can act on its receptor and potentiates TGF-β1 signaling. GB0139 binds to the galectin-3 carbohydrate recognition domain and blocks these protein-glycan interactions.
Article Snippet: After serum starvation, cells were stimulated with either 10 μg/mL
Techniques: Activation Assay, Binding Assay
Journal: The Journal of biological chemistry
Article Title: ATXN3 functions as a tumor suppresser through potentiating Galectin-9-mediated apoptosis in human colon adenocarcinoma.
doi: 10.1016/j.jbc.2024.107415
Figure Lengend Snippet: Figure 5. Targeted ATXN3 deletion inhibits colon cancer growth in mice. A–C, WT or ATXN3-KO HCT116 cells were injected subcutaneously into RAG1 mutant mice (n = 10). Tumor growth curve (A), photograph (B), and weight (C) are shown. D and E, the protein expression of Galectin-9, Ki67, Cleaved Caspase-3 in (B) tumor was detected by IHC and measured relative expression by image J software(n = 5). Scale bar: 200 mm. F–H, HCT116 cells were injected subcutaneously into RAG1 mutant mice and treated with Galectin-9 recombinant protein (n = 10). Tumor growth curve (F), photograph (G), and weight (H) are shown. I and J, the protein expression of Galectin-9, Ki67, Cleaved Caspase-3 in (G) tumor was detected by IHC and measured relative expression by image J software(n = 4). Scale bar: 200 mm. K–M, tumor growth curve (K) of RAG1 mutant mice injected subcutaneously with WT or ATXN3-KO HCT116 cells and stabilize overexpression of Galectin-9 by lentivirus (n = 20). Tumor photograph (L) and tumor weight (M) are shown. A, C, F, H, E, and J, 2- tailed unpaired t test. *p < 0.05, **p < 0.01, ***p < 0.001. L and M: ordinary 1-way ANOVA. *p < 0.05, **p < 0.01,***p < 0.001.
Article Snippet: In order to achieve in vivo overexpression of the recombinant protein Galectin-9, mice were administered intraperitoneal injections of Galectin-9
Techniques: Injection, Mutagenesis, Expressing, Software, Recombinant, Over Expression
Journal: Blood
Article Title: Galectin-1 drives lymphoma CD20 immunotherapy resistance: validation of a preclinical system to identify resistance mechanisms
doi: 10.1182/blood-2015-11-681130
Figure Lengend Snippet: Lymphoma Gal-1 expression correlates with CD20 mAb resistance. (A-C) Gal-1 expression inversely correlates with lymphoma sensitivity to CD20 immunotherapy. Scatter plots compare normalized (A) and quantitative (B) Lgals1 transcript expression and Gal-1 secretion (C) relative to CD20 mAb sensitivity for each lymphoma analyzed. (D) Addition of Gal-1 blocks CD20 mAb-dependent phagocytosis of lymphoma cells. Peritoneal macrophages were cocultured with labeled BL3750 lymphoma cells as in Figure 2A, with or without CD20 mAb or rGal-1 added to the cultures as indicated. Each dot represents the results of individual experiments, with bars indicating means. (E) Representative GFP and cell surface CD20 expression by BL3750Ctrl or BL3750Gal-1 cells (open histograms) vs BL3750 cells (top panels, shaded histograms) or isotype-matched control mAb staining (middle panels, shaded histograms). Values represent mean (± SEM) Gal-1 secretion by BL3750, BL3750Ctrl, and BL3750Gal-1 cells (bottom panel, pooled results from 5 experiments). (F) Gal-1 blocks CD20 mAb-dependent phagocytosis of lymphoma. Peritoneal macrophages were cocultured for 24 hours with labeled BL3750Ctrl or BL3750Gal-1 lymphomas previously incubated with control (top panels) or CD20 mAb (middle panels), with representative contour plots showing F4/80 vs labeled BL3750 staining and mean (± SEM) frequencies of phagocytosed lymphomas cells shown. Values represent mean (± SEM) frequencies of BL3750Ctrl (circles) or BL3750Gal-1 (squares) previously incubated with control (open shapes), CD20 (closed shapes), or CD19 mAb (gray shapes) and cultured for 3, 6, and 24 hours with macrophages from 3 to 5 experiments (bottom panel, n = 7-20 mice per group).
Article Snippet:
Techniques: Expressing, Labeling, Staining, Incubation, Cell Culture
![Lymphoma Gal-1 expression in the local microenvironment confers CD20 mAb resistance in vivo. (A-B) Gal-1 expression blocks CD20-mediated lymphoma clearance in vivo. Mice given BL3750Ctrl or BL3750Gal-1 cells were treated with control (open shapes) or CD20 (closed shapes) mAb 1 day later. Lymphoma volume (2 experiments, top panels) and mouse survival (2-3 experiments, n = 4-10 mice per group, bottom panels) were monitored for 60 days post-mAb treatment. (B) Representative lymphomas (top panel) and serum Gal-1 (lower panel) was measured in naïve mice and littermates given lymphoma cells 45 days after CD20 mAb treatment (2-3 experiments, 10 mice per group). (C) Human LGALS1 expression (GSE2350) by naïve, centroblast (CB), centrocyte (CC), and memory B-cell samples (open circles) in comparison with cells (closed circles) from patients with Burkitt lymphoma (BL), CLL [blood cells (1) or blood CD19+ cells (2)], diffuse large B-cell lymphoma [DBCL; lymph node biopsy (1) or node biopsy CD19+ cells (2)], follicular lymphoma (FL), hairy cell leukemia (HCL), or mantle cell lymphoma (MCL). (E-I) Significant differences between sample means are indicated. *P ≤ .05; **P ≤ .01; ***P ≤ .001.](https://pub-med-central-images-cdn.bioz.com/pub_med_central_ids_ending_with_2507/pmc04832507/pmc04832507__1886f7.jpg)
Journal: Blood
Article Title: Galectin-1 drives lymphoma CD20 immunotherapy resistance: validation of a preclinical system to identify resistance mechanisms
doi: 10.1182/blood-2015-11-681130
Figure Lengend Snippet: Lymphoma Gal-1 expression in the local microenvironment confers CD20 mAb resistance in vivo. (A-B) Gal-1 expression blocks CD20-mediated lymphoma clearance in vivo. Mice given BL3750Ctrl or BL3750Gal-1 cells were treated with control (open shapes) or CD20 (closed shapes) mAb 1 day later. Lymphoma volume (2 experiments, top panels) and mouse survival (2-3 experiments, n = 4-10 mice per group, bottom panels) were monitored for 60 days post-mAb treatment. (B) Representative lymphomas (top panel) and serum Gal-1 (lower panel) was measured in naïve mice and littermates given lymphoma cells 45 days after CD20 mAb treatment (2-3 experiments, 10 mice per group). (C) Human LGALS1 expression (GSE2350) by naïve, centroblast (CB), centrocyte (CC), and memory B-cell samples (open circles) in comparison with cells (closed circles) from patients with Burkitt lymphoma (BL), CLL [blood cells (1) or blood CD19+ cells (2)], diffuse large B-cell lymphoma [DBCL; lymph node biopsy (1) or node biopsy CD19+ cells (2)], follicular lymphoma (FL), hairy cell leukemia (HCL), or mantle cell lymphoma (MCL). (E-I) Significant differences between sample means are indicated. *P ≤ .05; **P ≤ .01; ***P ≤ .001.
Article Snippet:
Techniques: Expressing, In Vivo, Comparison